
When working in a business where there are different products, markets and stakeholders, it might be hard to decide and create consensus on what are the priorities. Everybody has an agenda and compete to get attention from senior management to acquire resources.
This situation can apply to different cases such as:
- What should be my strategy regarding marketing channels (SEM, display, email, affiliate, etc)
- What should be my marketing strategy regarding markets
- What should be the strategy regarding products?
If we listen to any of the different teams we will hear different versions of the story. A better way to have a plan is by using data. We can use a matrix to set each one of this channels, markets or products and then build a specific plan for different groups.
The retail market prioritisation case
I will be using an example of a hotel company that had been running some marketing activity in 13 different markets and has to make decisions about how to prioritise their marketing efforts. To do this we first need to run an analysis of the situation of each market.
For this purpose we will be using 3 main metrics: visits, revenue and transactions and one dimension markets.
Why this metrics? Because with these we can calculate 2 metrics that will give us a sense of the performance of the marketing activity in each market: conversion rate = transactions / visits and average order value = revenue / transactions.
We can build a pivot table and then use the resulting table to represent in a bubble graph the information. In axis X we will place average order value, in the axis Y the conversion rate and the bubble volume can be the sum of orders. When representing this in a graph it would look like this:
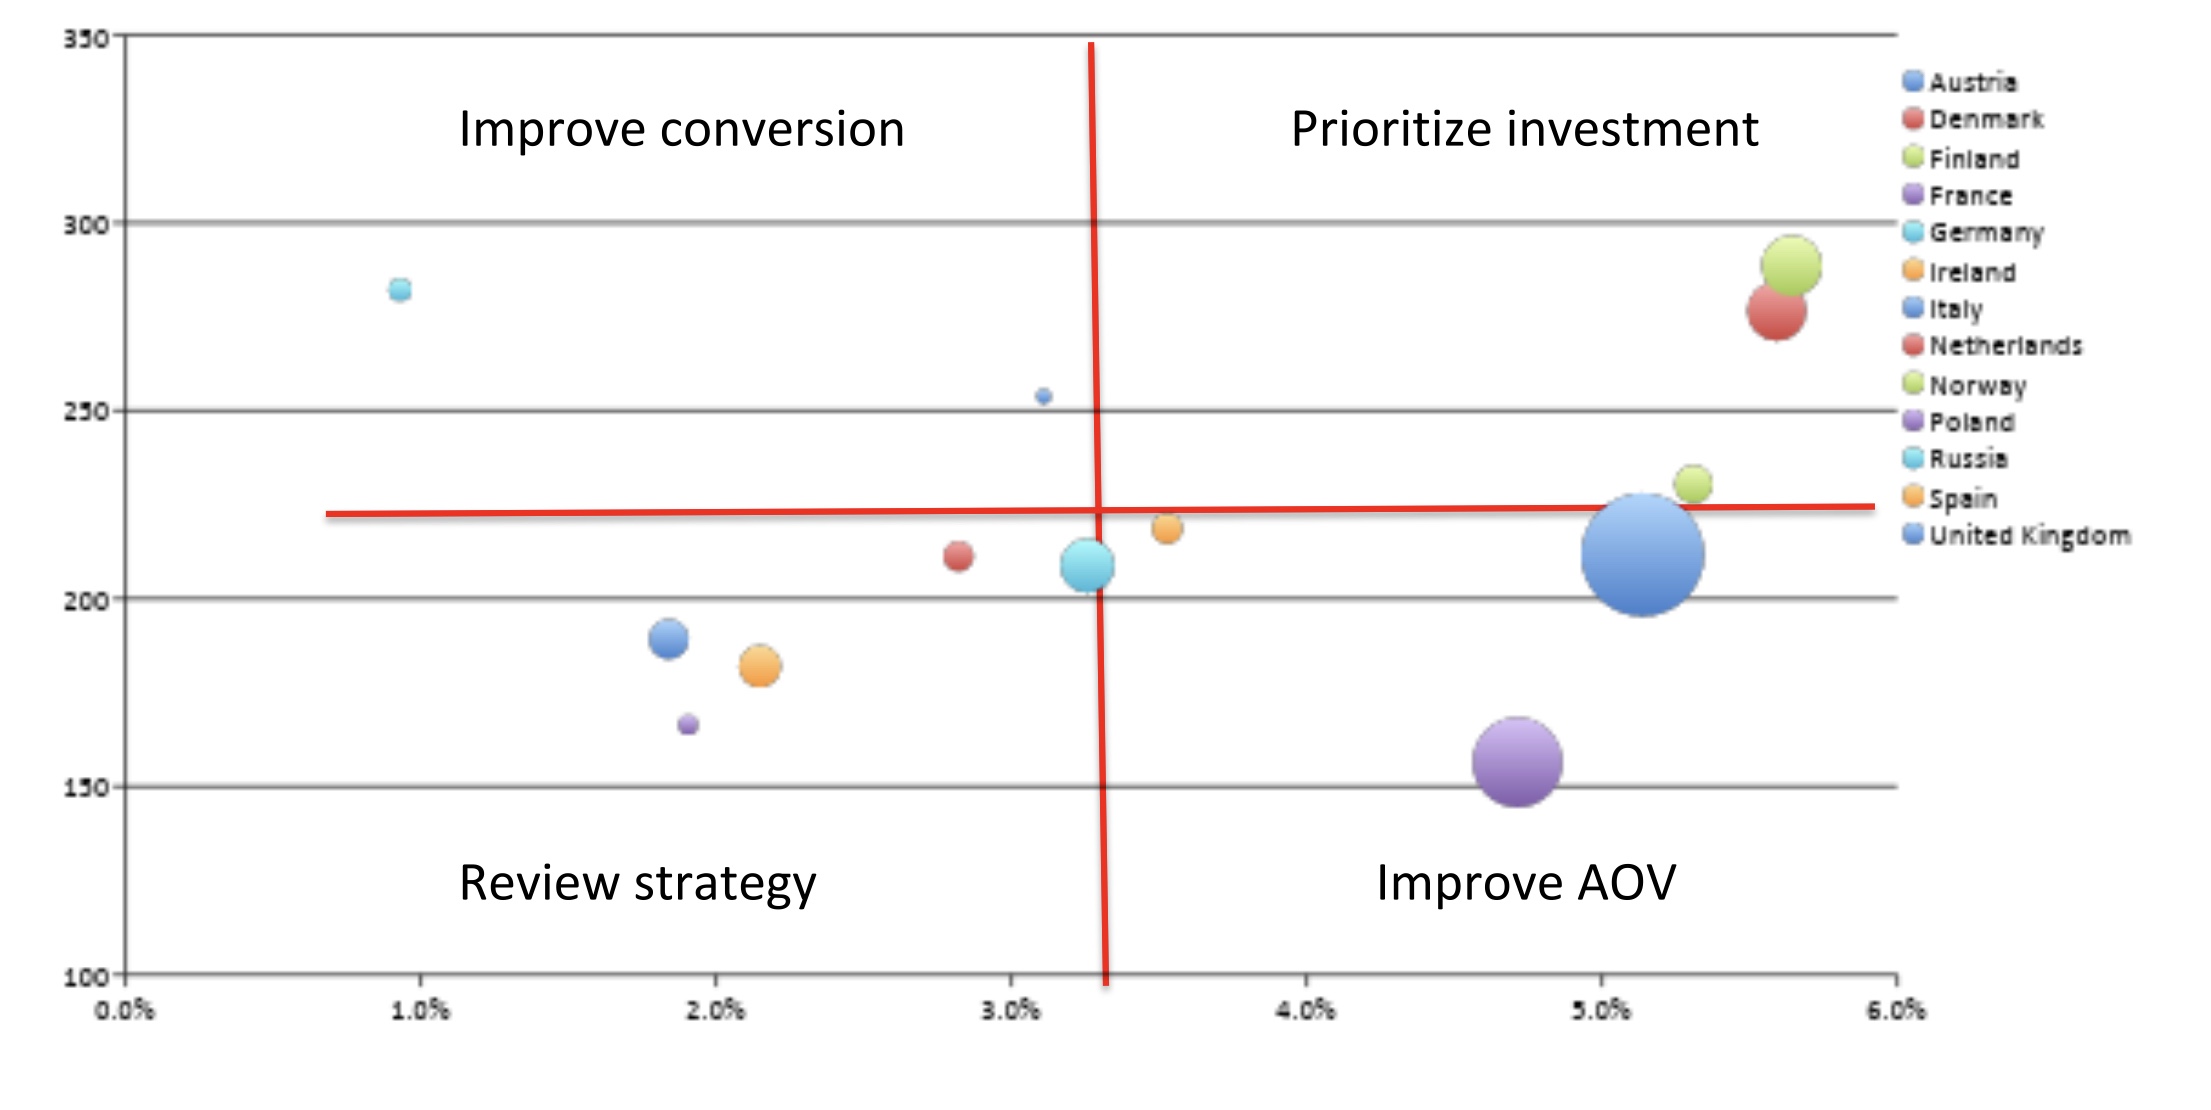
We can then add two lines to divide the graph in 4 quadrants, each of these quadrants will help us define a strategy for the group of markets that fall in:
Quadrant 1: Improve conversion
Quadrant 2: Prioritise investment
Quadrant 3: Review strategy
Quadrant 4: Improve AOV
We would primarily focus on the markets with the bigger revenue volumes/bubbles as these are the ones that would have a bigger impact on the overall results.
With this information we are in a much better situation to give some strategic direction to the plans and decisions of the near future.
I will give a few examples of what can be done to improve the situation in each of the quadrants:
Improve conversion
Work with product to improve the user experience, reduce frictions on the different steps of the purchase or conversion, improve messaging to incentivise or motivate users to complete a transaction. Examples of this can be as simple as: make sure to have the field tagging implemented to facilitate autocomplete of a form to have good reviews and testimonials that will be visible to the users who go through the funnel.
Work with growth marketing channels to make sure that higher quality of traffic is being driven to the landing pages, prioritise the investment in those channels that perform better traditionally like SEM or email.
Review the pricing or product offering, if this can be done at a market level, this could be a solution.
Prioritise investment
These are the markets that have hit the right spot and are providing revenue and conversion at the highest level. Most of the investment should be used in these markets as they will also be providing the resources to grow and improve performance in other markets.
Review strategy
These are the markets that are falling behind and don’t have a good conversion rate or order value. It might be that the nature of the product that we’re trying to sell is not fitting well in the society of the market, that there are cultural differences that make our products not of interest. If there’s a potential market the whole strategy should be reviewed.
Improve AOV
Improving average order value can be achieved but it’s not easy if customers are very price sensitive, if a good segmentation can be done then there might be chances to up-sell or cross-sell to improve this metric. Another way to do this would be by looking at the supply and finding products that are more appealing to the point of sale.
This can be part of an exercise done together with other teams this will help get alignment and consensus and assure there’s a collective agreement on the steps to follow. The priorities of each market can be placed in a shared document to build a roadmap that can be used to prioritise and work towards the future.

One thought on “Prioritising marketing efforts, data driven strategy visualisation”